Sebago Lake Water Levels Explained: What’s Normal and What Isn’t
By Sebago Lake Lovin
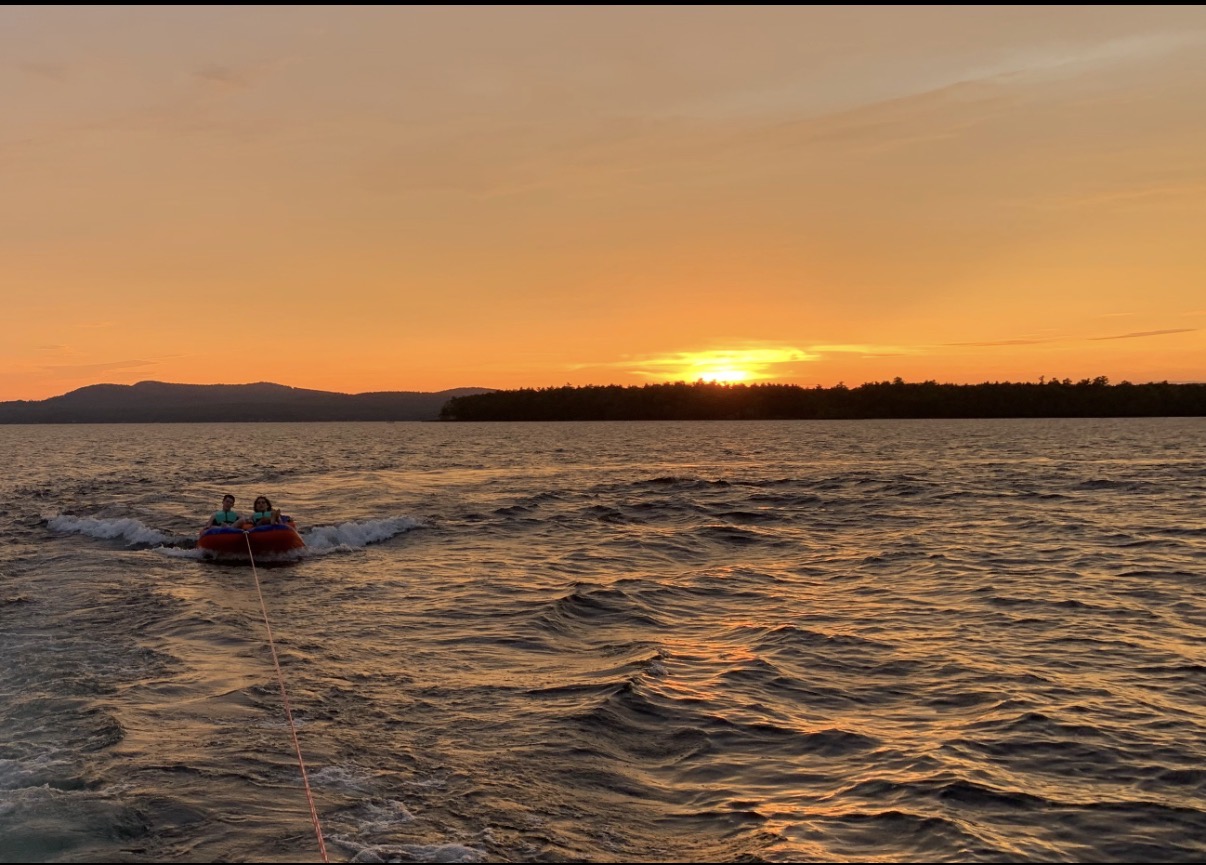
Is Sebago Lake Really Low?
If you have spent any time around Sebago Lake, you have probably heard someone say: "I have never seen the lake this low."
Every summer, conversations at marinas, on docks, in Facebook groups, and around campfires seem to come back to the same question: Is the lake lower than normal?
Sometimes it is. More often than not, though, Sebago Lake is simply following the same seasonal pattern it has followed for decades.
That is one of the reasons I built the Sebago Lake Water Level Dashboard. Rather than looking at a single number, it helps answer questions like:
Is the lake higher or lower than last year?
Is today's level normal for this date?
How does this compare to the past 25+ years?
Is the lake following its typical seasonal pattern?
View the Sebago Lake Water Level Dashboard
Everyone Has Their Own Lake Gauge
Everyone seems to have their own way of measuring the lake. Some people look at a favorite shoreline rock. Others judge it by the last step on their dock. Some know it is getting late in the season when they have to trim the motor a little higher leaving the cove.
For me, it is our floating dock. During the spring, when the lake is near its seasonal high, the dock sits almost perfectly level. By late summer it begins to slope. At the lowest water levels of the year, the walkway sits at about a 10 to 15 degree angle. The drop is about a foot and a half over the dock's 8-foot length, which means the lake itself has dropped roughly a foot and a half from its seasonal high. It has become my unofficial water level gauge.
Here is what that looks like in practice. The side by side comparison below shows the same floating dock in May, when the lake is near its seasonal high and the dock sits almost perfectly level, versus August, when the lake has dropped about a foot and a half and the walkway tilts at roughly 10 to 15 degrees.

May: The dock sits nearly level with the lake near its seasonal high.
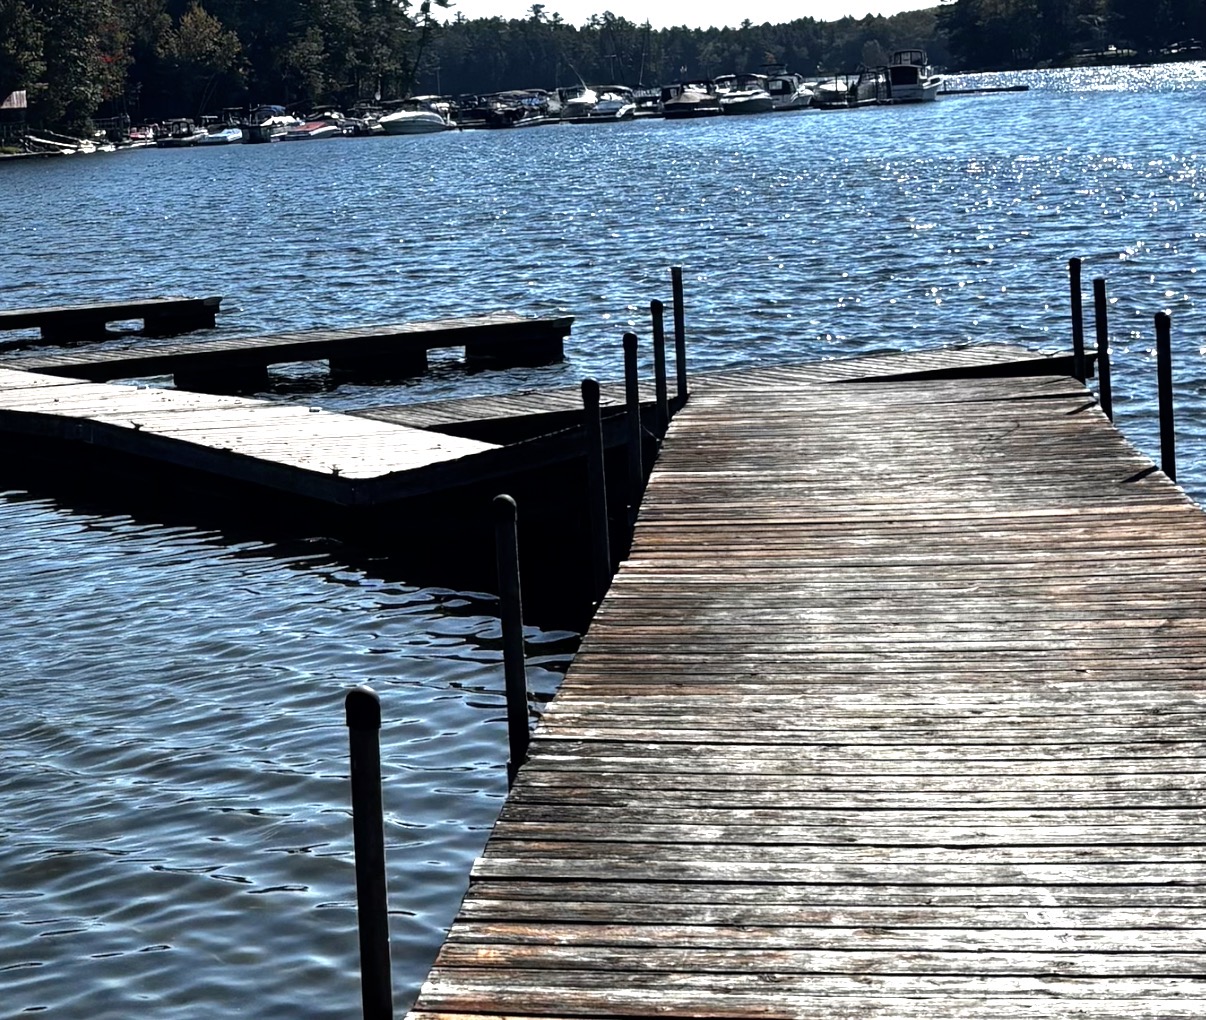
August: The dock tilts about 10 to 15 degrees after a foot and a half drop.
Of course, everyone's reference point is different. That is one reason our memories can be misleading. A rock that looks unusually exposed this August may have looked exactly the same three years ago. That is why historical data is so valuable.
Sebago Lake Follows a Seasonal Rhythm
One of the biggest misconceptions is that Sebago Lake should stay at roughly the same elevation all year. It does not. Like most lakes in New England, Sebago follows a very predictable seasonal cycle.
Seeing more shoreline in August is not unusual, it is expected. Depending on weather and dam operations, Sebago commonly changes by several feet over the course of a year.
The dashboard's Seasonal Trends chart makes that cycle easy to see. Instead of daily readings, it rolls the data up by month so you can watch the lake rise and fall across a full year, with the current range shown as bars against last year's line and the long term historical median.
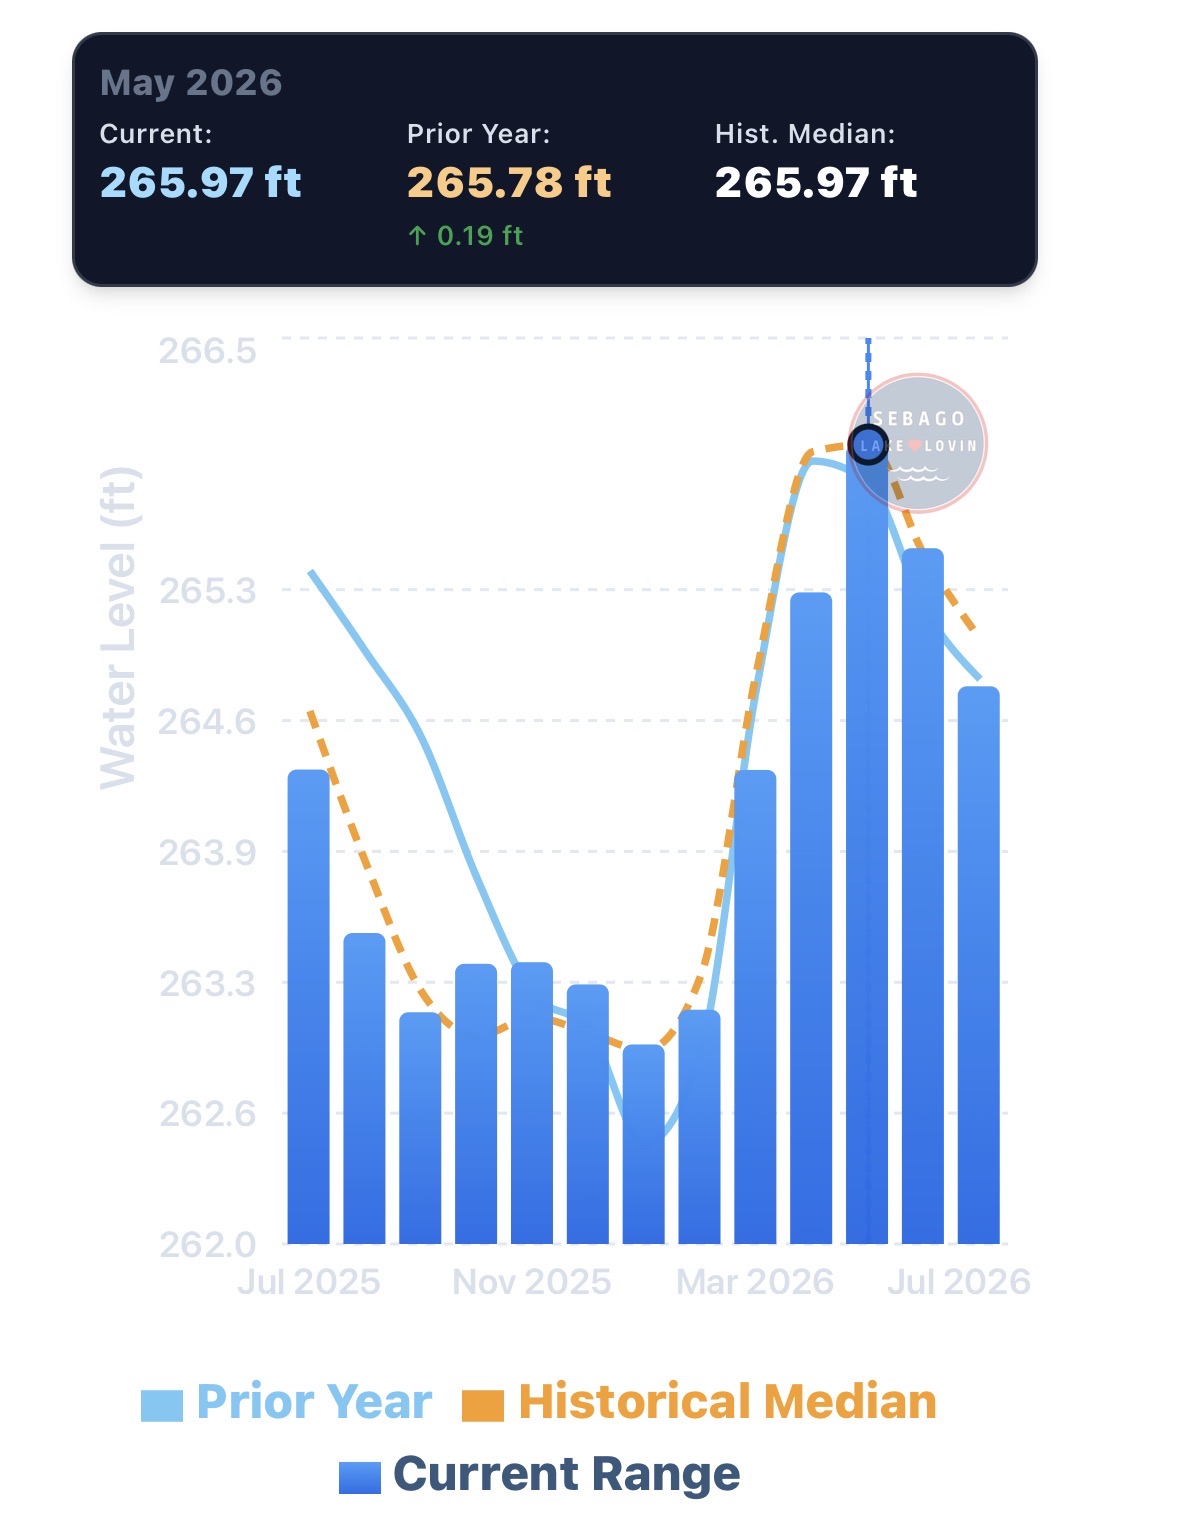
Seasonal Trends on the Sebago Lake Water Level Dashboard. Tap any month to compare current, prior year, and historical median levels.
A few things the monthly view makes obvious:
January is typically the lowest month of the year. The lake is drawn down heading into winter and there is no snowmelt yet to refill it.
March through May is the fastest climb. Snowmelt and spring rain can raise the lake a few feet in a matter of weeks.
May is usually the annual peak. If you want the lake at its fullest, that is your month.
The summer slide is gradual, not dramatic. June through September steps down month by month, which is why late August always looks lower than the Fourth of July. By September some docks no longer have enough water and boats start coming out.
Year over year context. Comparing the bars to the prior year line and historical median shows whether this year is genuinely unusual or just following the script.
Daily numbers tell you where the lake is right now. The monthly trend tells you whether that is normal.
Why Does the Lake Change?
Several factors influence Sebago's water level: spring snowmelt, rainfall, tributaries flowing into the lake, and summer evaporation.
And another factor many people do not realize, Sebago Lake is dam regulated. The Eel Weir Dam operates under a Federal Energy Regulatory Commission (FERC) license and balances recreation, downstream river flows, environmental needs, hydropower, and drinking water needs.
The result is a lake that follows a natural seasonal pattern while also being carefully managed.
Why I Built This Dashboard
The official USGS Sebago Lake Monitoring Station is an outstanding resource. It provides real time lake levels, historical records, statistics, and decades of observations. The Sebago Lake Lovin dashboard uses that official data.
This is not a replacement for USGS, it is a complement to it. USGS presents information for scientists, engineers, and water resource professionals. The dashboard takes that same data and adds historical medians, year over year comparisons, percentile rankings, and seasonal trends so boaters, homeowners, anglers, and visitors can read it at a glance.
The USGS site tells you what the lake level is. The dashboard helps explain what it means.
Understanding the Dashboard
Every chart on the dashboard answers a different question.
Current Water Level
Shows today's official lake level along with the recent trend.
Current Year vs. Prior Year
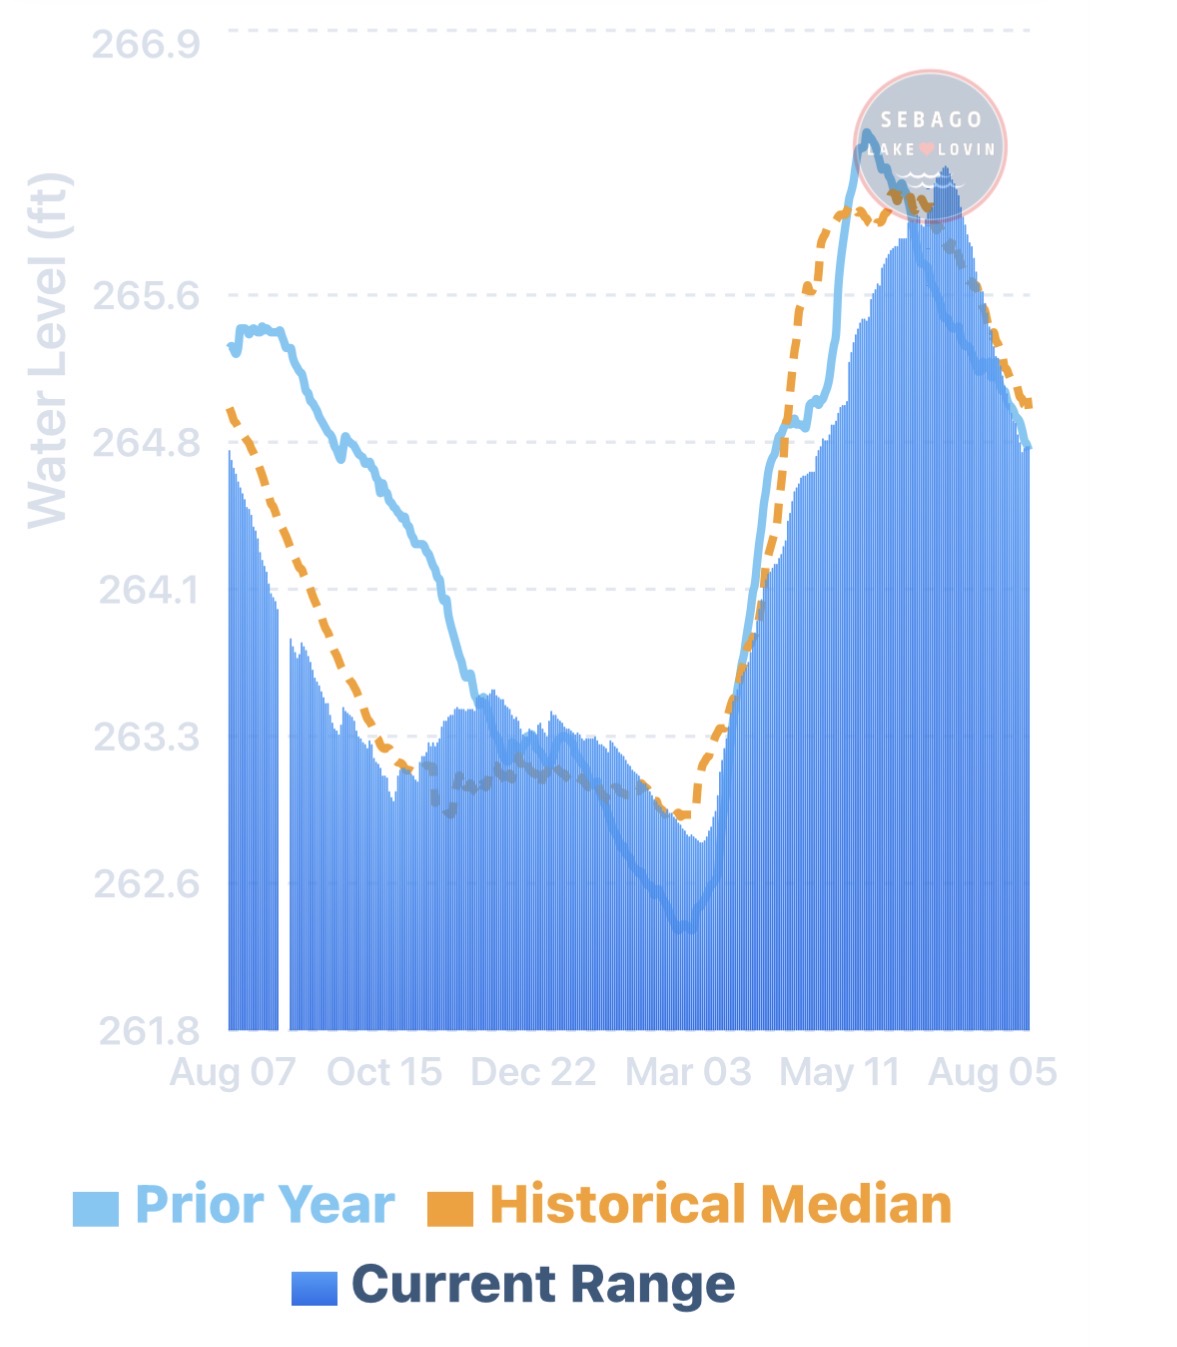
See whether this year's lake level is tracking above or below last year's seasonal pattern.
Above or Below the Historical Median
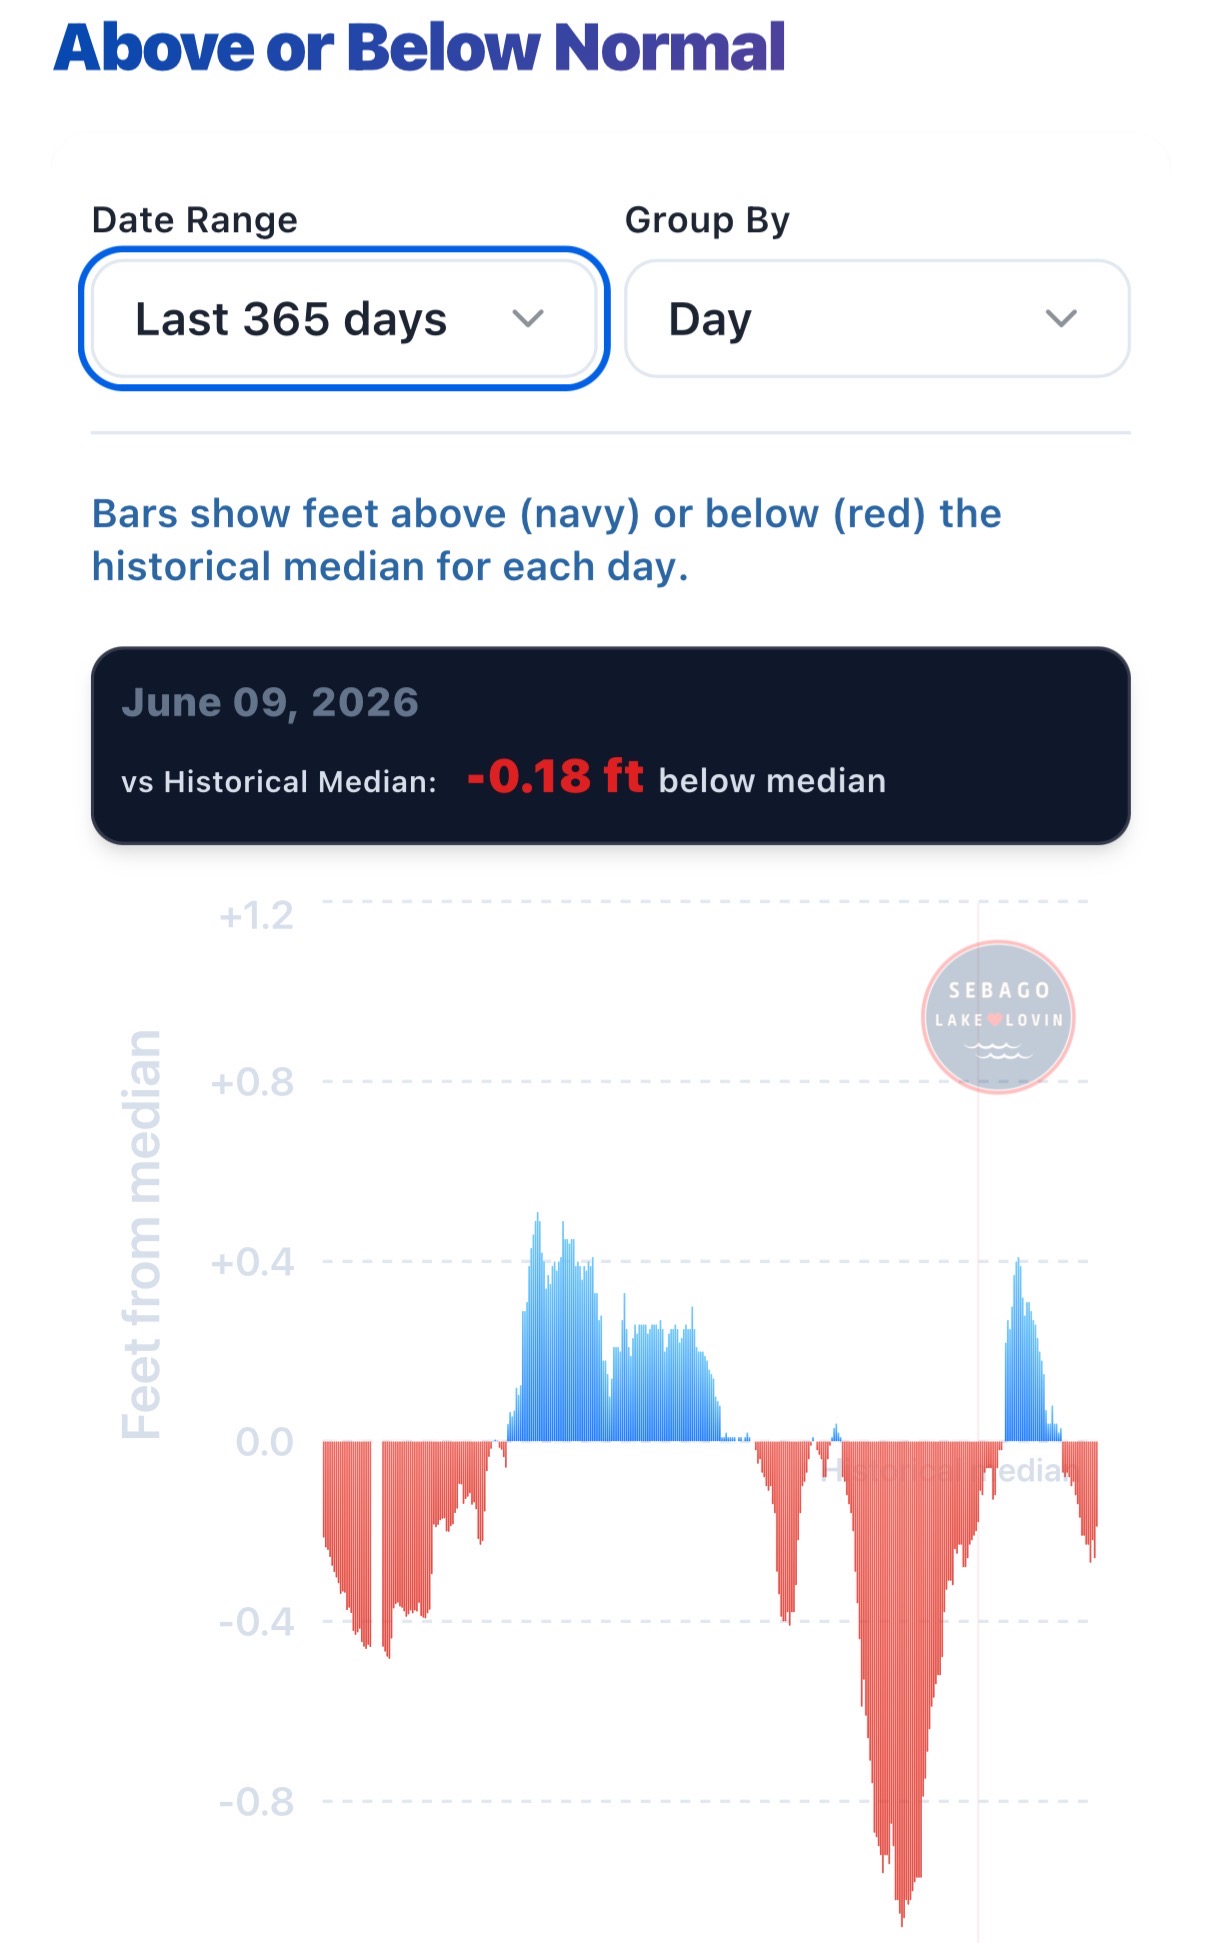
This is one of my favorite charts. Rather than asking whether the lake is simply high or low, it shows whether today's water level is above or below what history says is typical for this date.
Some years spend months above average. Others spend months below. Most cross back and forth several times throughout the year.
Historical Ranking
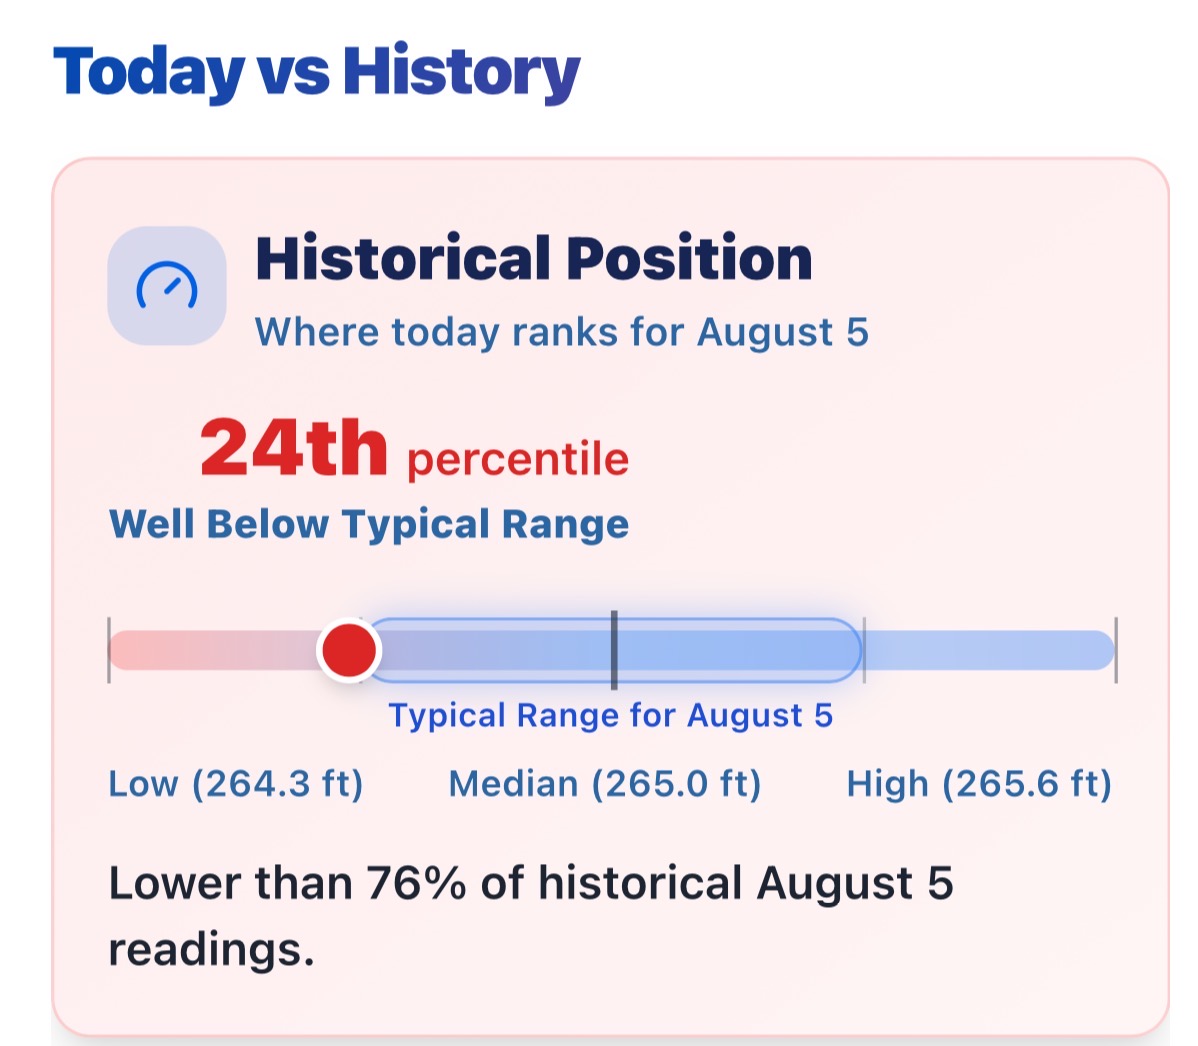
Ever wonder whether today's lake level is unusually high or low? This chart ranks today's reading against more than two decades of history and shows its percentile.
Historical Comparison for Today's Date
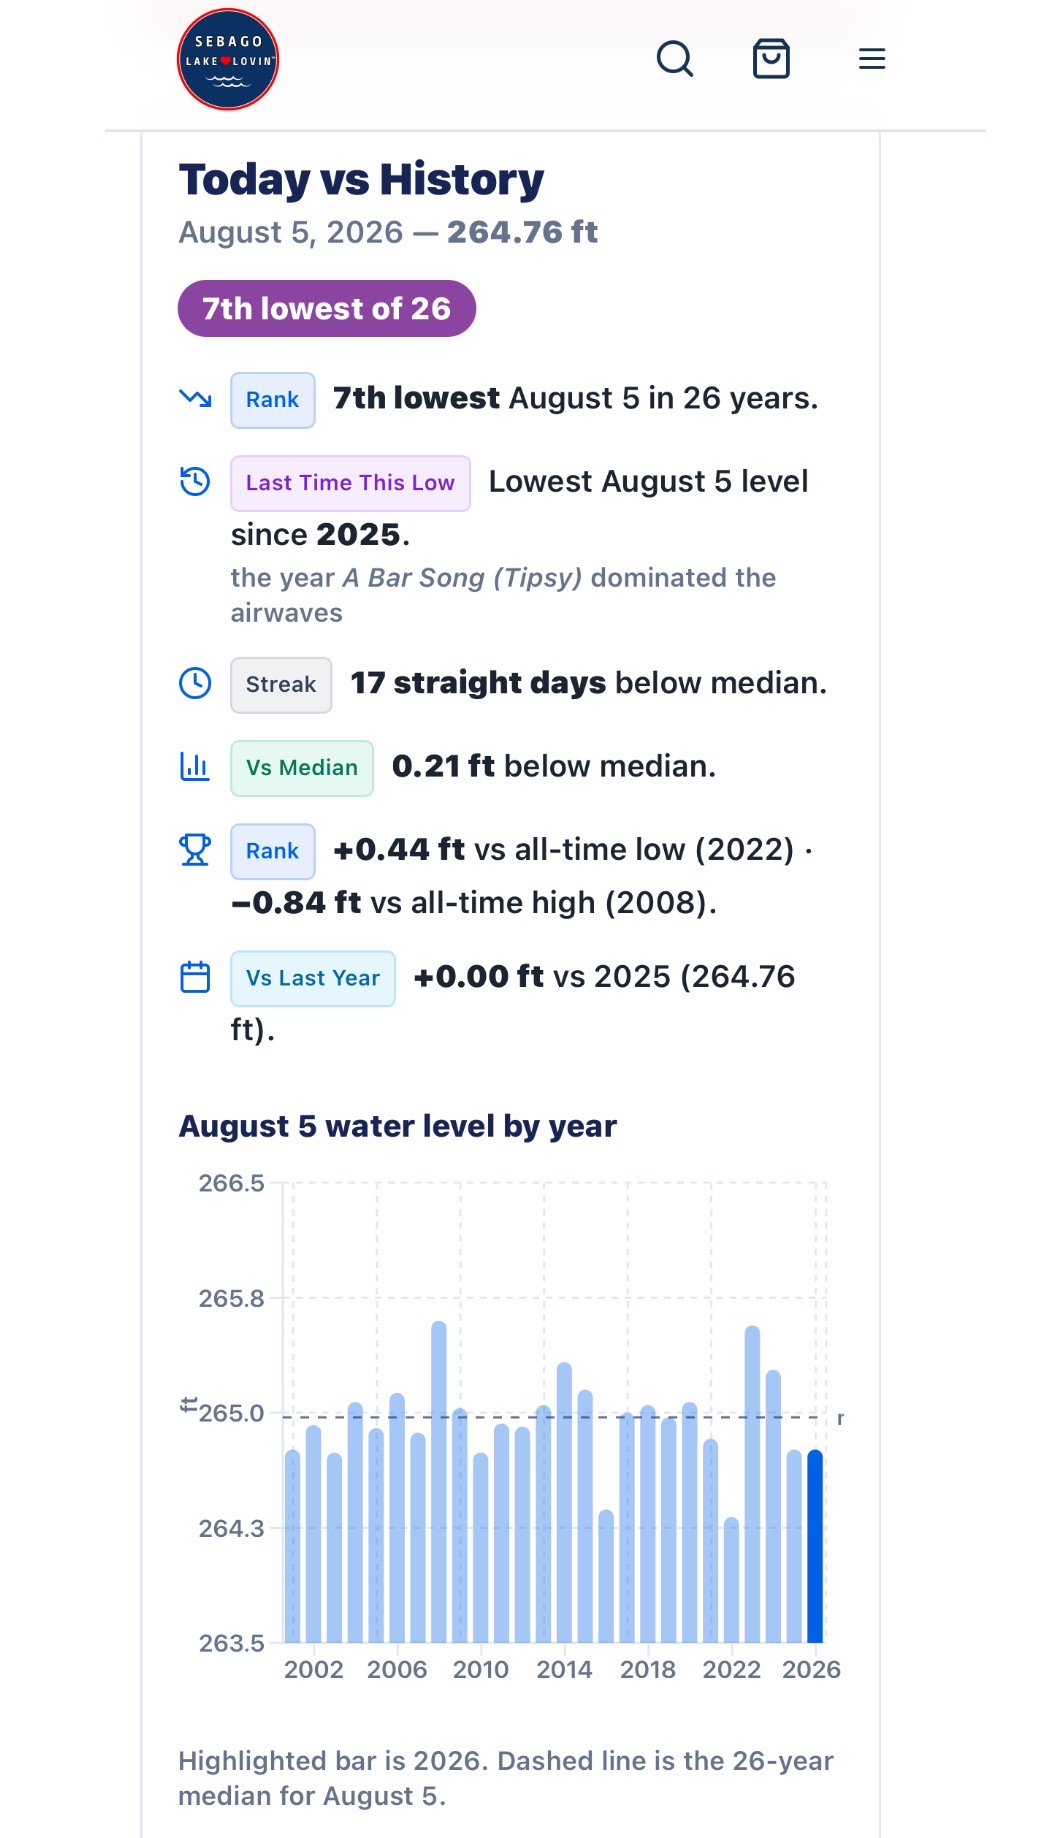
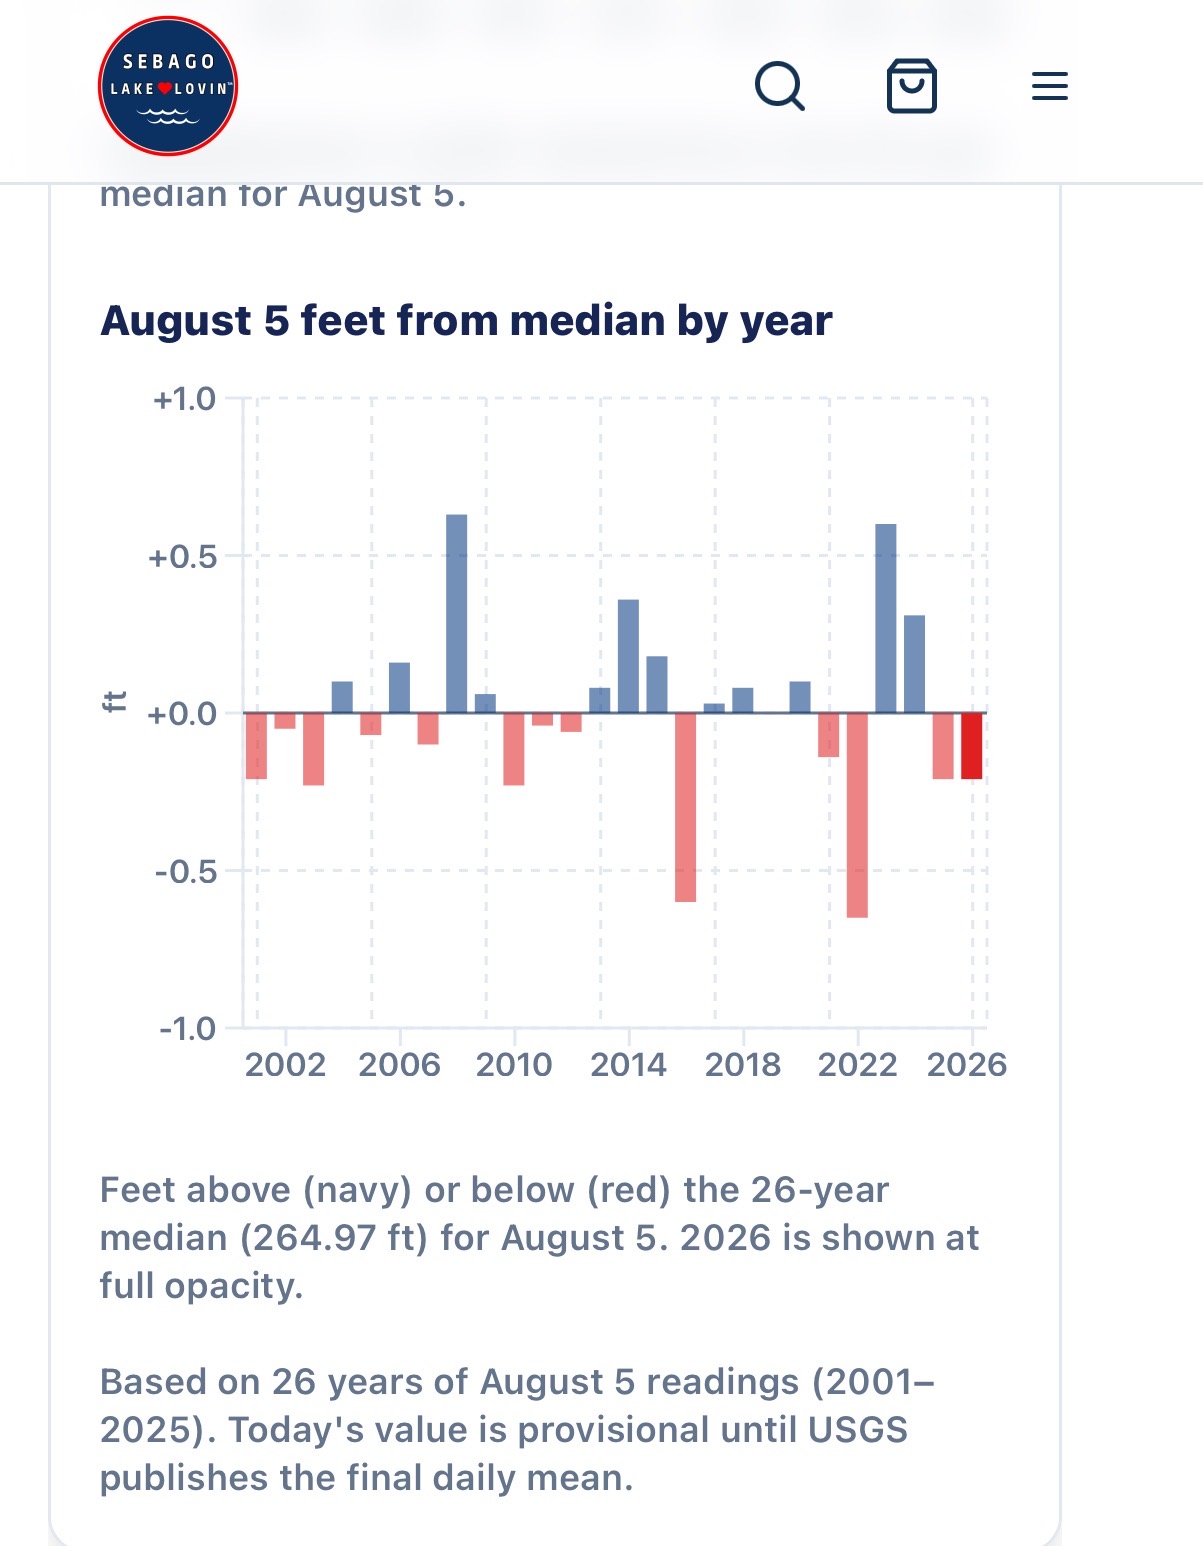
This chart compares today's calendar date with every other year in the historical record. It is a great way to see whether this year is truly unusual or simply another point within Sebago's normal range.
What Boaters Should Know
As summer progresses, you will begin noticing:
More exposed rocks
More visible ledges
Sandbars becoming easier to spot
Less water around docks
Narrower channels in some locations
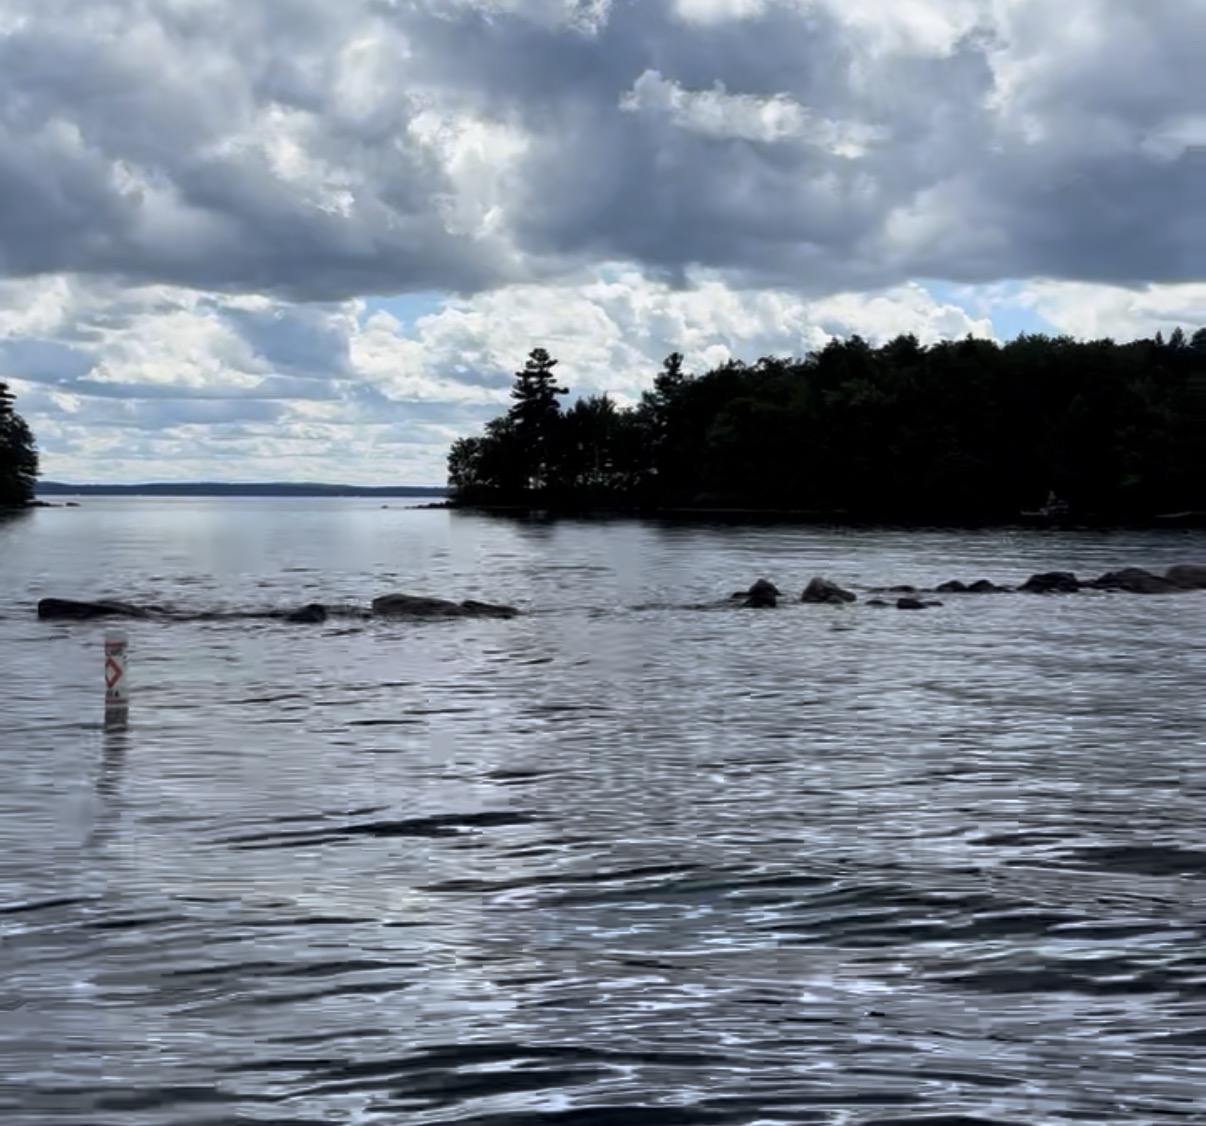
Late summer is a great time to slow down in unfamiliar water and pay attention to your depth finder. The rocks are not moving. The water around them is.
Where the Data Comes From
The Sebago Lake Water Level Dashboard uses official water level data from the U.S. Geological Survey (USGS).
Readings come from the Sebago Lake monitoring station and refresh automatically. If you would like to dig into the raw records, visit the official USGS monitoring station.
The Bottom Line
Every summer, people ask: "Is the lake unusually low?" Sometimes the answer is yes. Often it is no. Either way, we can now answer it with data instead of guesswork. The story is never today's number, it is what that number means.